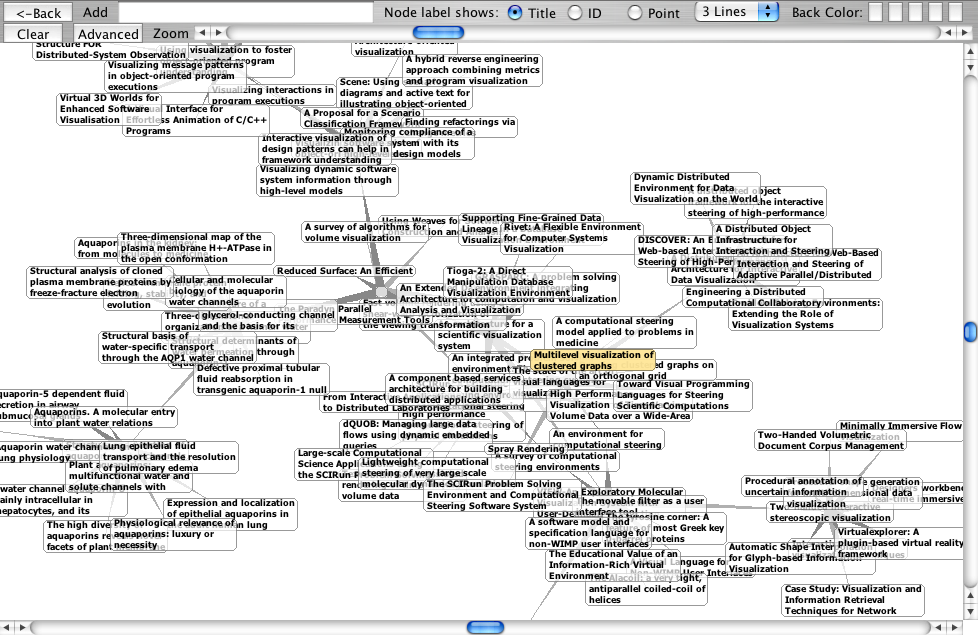
I've made a rough version of a TouchGraph browser for Google Scholar. Use this ->GraphScholar<- bookmarklet to launch it from any 'Cited By' page on Google Scholar - like this example page, or a direct link to the graph if you just want to see how it works.
Double clicking on any of the nodes will load a new set of papers which cited the selected paper - in other words, opening up new nodes moves forward in time through citations.
Clicking on the 'info' box will open a window with a link back to Google Scholar, from where you can get to the full text.
This is where I rant again about closed citation databases - Google's Scholar, Elsevier's Scopus, ISI's Web of Science, NEC's CiteSeer and CiteBase all duplicating the same work and (with the exception of CiteBase, which is only experimental) not making it available for other people to work with. I was at an ISI presentation the other day, and an audience member asked whether there would be any visualisation tools available for the Web of Science. The presenter said something like, perhaps, in a couple of years, maybe - but there must be hundreds of people working on visualisation who could do it tomorrow if they had access to the data.
There may be better tools for citation visualisation that can present the concept of a linear timeline, such as prefuse, JUNG or SpaceTree (again, if they had access to the data). Similarly, it would be very useful to be able to work backwards through the citations, from a new article to a classic original, but there's no way to do that with Google Scholar yet.